By Chuck Newcombe

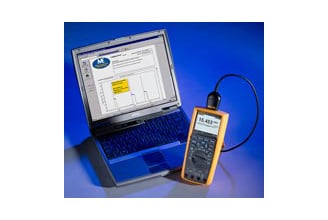
One of the major features of the Fluke 280 Series digital multimeters (DMM) with TrendCapture is their ability to record measurement data or "do logging." This application note explains what kind of logging these meters can perform, how to use the recording feature, and the information that can be provided to you. This note also discusses how FlukeView® Forms PC software is used to increase the power of the Recording feature.
When the Fluke 289 is recording, it's looking for periods of stability. For each stable or unstable period, the meter logs a start time, the initial reading, stop time, the maximum reading, minimum reading (and the times of their occurrence) and average reading during that period. The event recording feature is designed to store only enough information to describe any changes; i.e., events, to the input signal.
The Fluke 289 excels at recording transition events, but while it has Trend Capture on-screen graphing capability, it does not have the kind of large graphical display needed to view the event data. This is where FlukeView Forms software takes over, allowing you to view the recorded data in table or graph form on a PC.
Download the application note Event recording (or logging) with a Fluke 287/289 Digital Multimeter application note
Watch this step-bys-step tutorial on how to use Data Logging on the Fluke 289 Digital Multimeter: