More than 40% of industrial motors work at or below 40% of their load rating. That means poor power factor and inefficient operation. Efficiency of all motors can drop over their lifetime, which increases energy and maintenance costs and can even increase plant downtime. Monitoring drive efficiency catches the symptoms early.
The four key power quality measures are:
- active (real, useful) power in KW,
- apparent power (complex, that you actually pay for) in kVA,
- reactive (imaginary, wasted) power in kvar, and
- power factor, the ratio of active against apparent power.
Motor problems and causes
Ideally, all the power should be converted to mechanical energy to drive the load. The active power would then be the same as the apparent power, with reactive power being zero and a purely resistive load, so a power factor of 1.
Finding the exact problem
Pinpointing the exact problem needs accurate data and analysis from a Power Quality Analyzer like Fluke’s 438-II.
Input power measurements (“Power and Energy” mode) are normally taken at nominal frequency while output measurements need to be analyzed across a broader frequency range. This is to ensure we can pick up any harmonic distortion the motor may introduce (“Motor analyzer mode”).
The screenshots give valuable clues to the instantaneous drive performance. The three phases show different values because there are slight variations in the mechanical load. The drive also has a buffering effect in the DC bus.

Input power of a drive compared to the output power
The input screen (left) shows the active power to the 1.1 kW drive as 1.0368 kW. The apparent power is 1.2349 kVR, the reactive power 0.0239 kvar, and the power factor (1039.12/1.2349) 0.84. The total kW and kVA powers are slightly smaller than the arithmetic sums of the individual phase powers because of some unbalance. The total kvar power is slightly smaller than the average phase powers.
The output screen shows the corresponding figures as 0.928 kW, 1.380 kVA, 0.668 kvar, and power factor 0.69. Although the active output power drops slightly, the apparent power actually increases because of the high reactive power being delivered into the motor.
The two screens below show an instantaneous drive efficiency of 0.928/1.0368 = 90%. A more accurate real-world figure is the average efficiency, which is calculated by the statistical data in Fluke’s 438-II PowerLog software.

Average input power to the drive

Average output power from the drive
These two screens show average active input and output powers of 922.87 W and 1039.12 W respectively, giving an overall drive efficiency of 88.8%. This is quite normal for such a small, fully-loaded drive.
Oversized drives
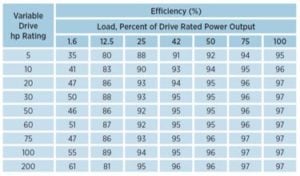
We performed the same test on a 5.5 kW drive with the same load. The input power is now 1009.85 W and the output power is 893.96 W, giving a drive efficiency of 893.96/1009.85 = 88.5%. This confirms that an oversized drive gives a lower efficiency (see Table 1, 1 hp = 0.75 kW).

Figure 1. Measurement on the output of VFD with Fluke MDA.

Table 1. Adjustable speed drive part-load efficiency
Motor efficiency
Fluke’s 438-II also measures key parameters like speed, torque and mechanical power without it needing mechanical sensors. That tells you the actual efficiency of the motor as it drives the load.
It’s not just these headline figures that are important. They also give a baseline for monitoring performance throughout the life of the motor and drive. Changes in power factor and efficiency will expose potential problems early. Maintenance engineers will then have solid data behind them to investigate issues before they cause expensive motor failures and (much more expensive) production downtime. That can give Power Quality Analyzers very short repayment times.
Both motor and drive should match the power rating of the load to ensure maximum efficiency and prevent energy losses.