Stan Benoit often finds himself engaged in politics, even though his expertise is in electronics and medical imaging. A CRES Radiology/Oncology Maintenance Supervisor at Geisinger Health System, Benoit is responsible for keeping dozens of complex imaging systems at peak performance for 5 hospital campuses and 31 satellite facilities. Suspected PQ issues can put him between equipment manufacturers and in-house electricians.
Downtime is costly, both in terms of patient wellbeing and monetary costs - the X-Ray, mammography, and other systems themselves cost millions and a failure can also idle technicians or surgical teams. Most of the facilities have motor/generators and can maintain operations independent of the utility, making the power system robust but also complex. In addition, the facilities are constantly being improved to accommodate the best medical technology available. Engineers and electricians have to work with power systems that are always changing. For Benoit and the people he works with, talking about power quality is part of everyday life.
When complex CAT Scanners, MRI, and cardiac catheterization systems experience problems, the first question is: "Is it the electronics or is it the power?" To answer this question, and ultimately fix the problem, Benoit has to work with several different organizations. Equipment vendors support the imaging electronics under contract. An in-house facilities department maintains electrical systems, often with support from outside electrical contractors. This situation naturally turns "is it electronics or power?" into "whose problem is it?"
Benoit is a 23 year veteran of medical electronics, but he was not an expert on power quality. And without hard facts he found it difficult to orchestrate the electrical and electronic teams. Last year he acquired a Fluke 434 Power Quality Analyzer and started learning more about power quality.
Charging up the Learning Curve
Benoit wanted to be able to do basic tests on three-phase power to get his facts straight before talking to manufacturers or electricians. He also wanted a tool that would provide more details as he learned more about power quality. One of his most important requirements was the ability to share data among the various parties - sometimes this means a detailed report but it can also mean standing at a panel and looking at a real-time display. He had to have a tool that his colleagues inside and outside of his organization would trust. The Fluke 434 was a good fit.
Sometimes tracing through the electrical system can be challenging. He is careful to have professional electricians help make connections and identify the circuits. Benoit read the 434 manuals, some of the Fluke app notes, and browsed a couple of books, but mostly he's learned by looking at measurements on the 434 and working with equipment vendors, electricians and PQ experts.
How Stan Benoit uses the Fluke 434
Since he got his 434 last year he has used it almost constantly. He has applied it on X-Ray, CAT, MRI, and linear accelerators. In addition to troubleshooting, he also uses the 434 to check power quality before installing new imaging systems. And in many cases he uses it to demonstrate that power quality is probably not the cause of a failure.
He really likes the color graphical display, especially the connection screens that help him set things up properly. The display lets him share and discuss (argue over) waveforms and trends in real time. Then he uses the PC interface to download the data to his computer and generate a complete report. He customizes his reports to suit his audience, "I have to talk about this stuff with doctors and administrators. I have to make it clear."
For troubleshooting, Benoit turns first to the 3-phase scope display on the 434 to check the shape of the voltage waveform. The phasor display helps confirm that the connections are good and gives a quick snapshot of system balance.
To help track intermittent problems, he often uses the Dips and Swells mode. In this mode the 434's Autotrend capability immediately analyzes voltage and current without any setup, identifying changes as short as ½ line cycle. While he is in Dips and Swells mode, he can run the imaging system through its paces, cycle nearby equipment, or transfer to backup power systems and observe the effects on the 434. On the instrument screen, Benoit can view the events using the cursors and zoom tools while background recording continues.
If he doesn't turn up anything in Dips and Swells mode, he works the system over with the 434 in Transient mode. In Transient mode, the 434 can capture and display even shorter events - down to 5 uS.
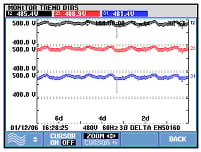
Recently Benoit used the Dips and Swells mode to track down problem with a mobile imaging system. The system was shutting down intermittently and seemed to have the most trouble during hot weather. According to Stan, "We had the recording running and it looked familiar, like a paper stripchart recorder. We saw all three phases drop when we heard the coolers come on." These truck-mounted systems carry their own cooling systems and a high inrush current caused a voltage dip when the fans came on. During summer months, demand on the utility is high and voltage levels can run a bit low, especially in rural areas that would be served by a mobile imaging lab. So during balmy weather the voltage dips were more likely to cause the imaging system to drop off line."
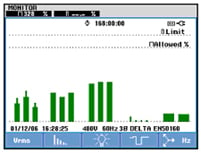
To judge the quality of power for a new installation, or to help rule out power disturbances as a cause for equipment problems, he uses the System Monitor function on the 434. This is the function he uses most often. With a single button he can initiate a comprehensive study of voltage quality.
The System Monitor Function
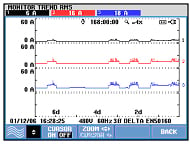
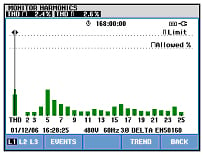
Most power quality problems can be detected by taking detailed voltage measurements and tracking how they vary over time. A power system that consistently delivers strong, stable voltage is a healthy system. The System Monitor function in the Fluke 434 analyzes dozens of voltage characteristics against preset limits for up to a week, and presents this wealth of data in a single pass/fail display. To look at how Benoit uses this function, we'll examine an evaluation he did on the power feeding an MRI system.
System Monitor uses limits from the EN50160 Power Quality Standard to determine if voltage characteristics are within acceptable tolerances. The characteristics it looks at are:
- Average rms voltage
- Harmonics
- Flicker
- Voltage Events (dips, swells, rapid changes, or interruptions)
- Balance
- Frequency
System Monitor tracks all of these characteristics for up to a week. It also records current to help determine the cause of voltage changes.
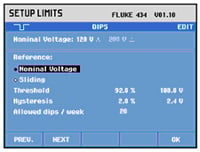
You can use the EN50160 limits which are the defaults, or you can adjust them to suit your needs. In this case Benoit reviewed manufacturer's specifications and decided to set the voltage limits a bit tighter, to 92% instead of 90%.
The Details Behind Pass or Fail
Each of the voltage characteristics on the main System Monitor display as a pass/fail bar. But behind this simple display is a lot of detail.
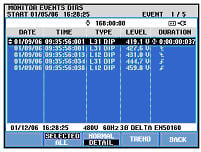
In Benoit's voltage data you can see the weekly generator test required for hospitals. The transfer to backup power shows up as a dip of roughly two cycles. You can see the working rhythm of the building - low currents during the weekends and nighttime, high current during working hours.
Stan Benoit has learned a lot about power quality over the past year. To some extent he is becoming a victim of his own success. He's worked with other biomedical engineers to debug a problem with a cardiac computer system. He's been called in to check power feeding HVAC chillers. "Since I've gotten the 434 I've been doing favors for people I didn't even know!" He's counting on two things that will make him less "popular": first that he can teach some of his co-workers what he's learned, and second that other departments will get their own power quality analyzer.
Check Your Connections on a 3-Phase System
One of the most common mistakes people make in checking 3-phase systems is incorrectly connecting their instrument. It can take nine connections to measure a wye system, so it can be easy to swap leads or forget to make a connection. The 434 uses color coding on leads and on the display. This will help, but it's best to check the phasor display to confirm your connections.