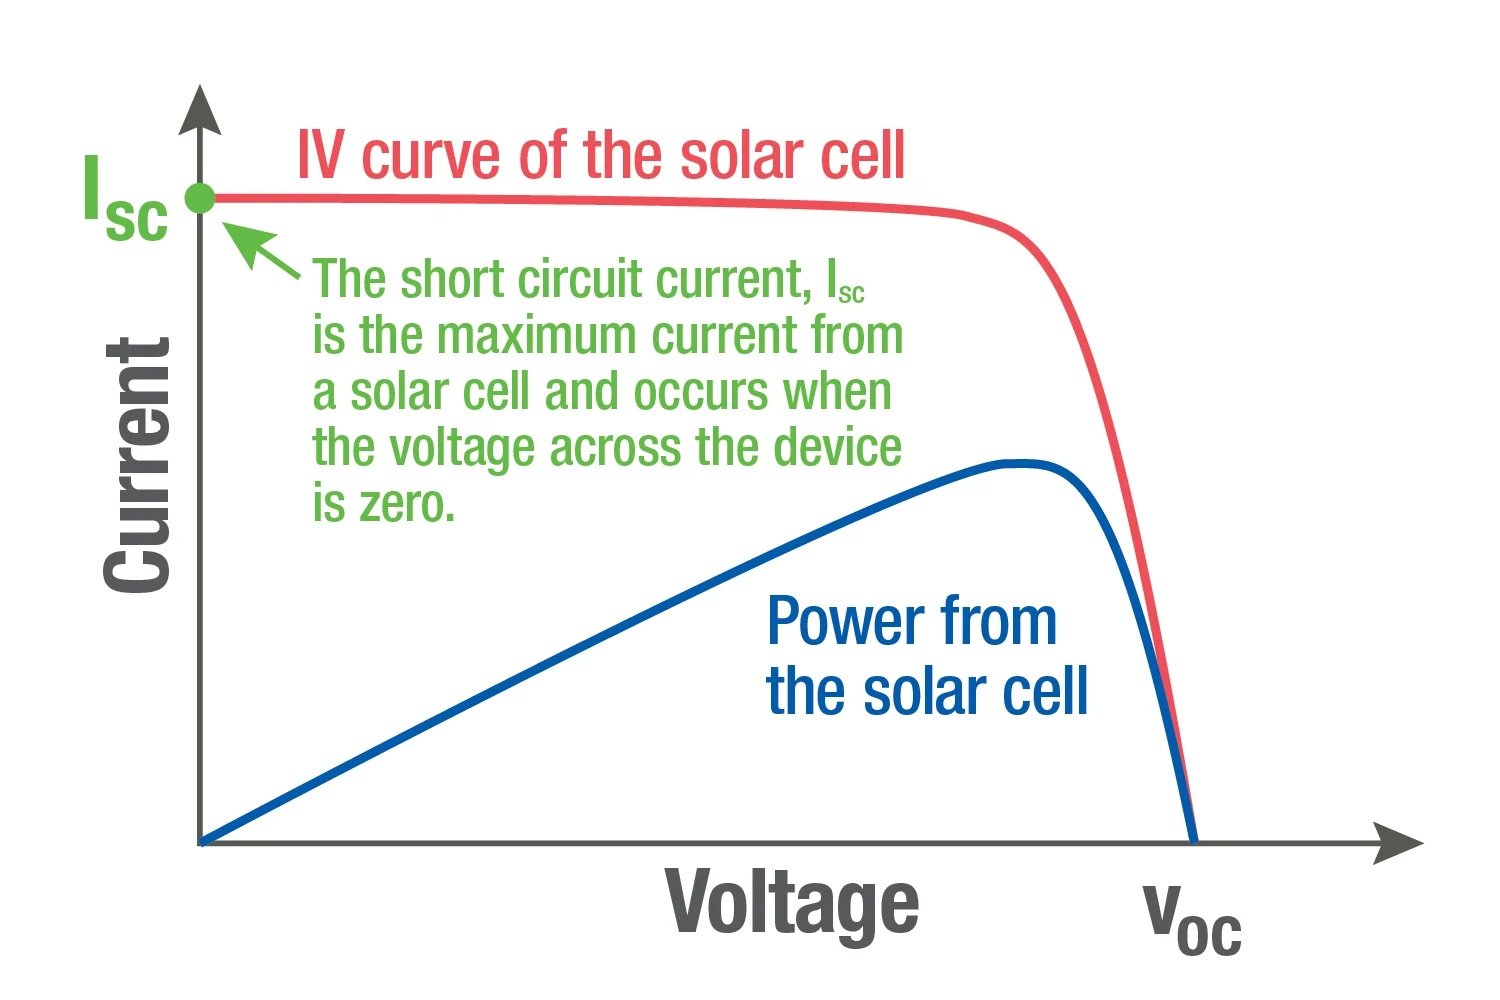
An I-V curve is a graphical representation of measured current (I) and power as a function of voltage (V). I-V curve tracing is integral to your evaluation of PV module performance and diagnosis of degradation in power output. You can use an I-V curve tracer as an efficient alternative to the combined use of a digital multimeter, clamp meter, and irradiance meter to measure current and voltage.

The I-V curve is used to validate proper operation for PV systems during manufacturing and installation, and to assess operation during maintenance. I-V curve measurements in PV modules are compared to an expected results curve, allowing technicians to analyze faults affecting performance based on deviations against the benchmark graph. The power versus voltage curve is also used to outline the peak or maximum power output benchmark, and the I-V curve is evaluated to optimize performance such that it intersects with the max power peak for maximum power generation.
Why are I-V curve measurements important?
Consistent PV module screening with I-V curve tracing helps you manage the quality assurance of your project’s PV modules so that they provide reliable power generation. When you analyze the measured I-V curve against the expected curve, you can identify internal and external faults such as a damaged solar cell, shaded areas, increased temperature strains, or defective bypass diodes.

While short circuit current and open circuit voltage metrics are available with digital multimeters and clamp meters, I-V curve tracing allows for measurement when the module is under load. Understanding performance under load provides non-invasive diagnostics for PV module performance, which prevents costly, time-consuming, and invasive repairs that detract from overall PV system capabilities.
The voltage and current ratings of an I-V curve tracer determine the size of PV system it can measure safely. For example, 1000 V (instead of 600 V) means an instrument can measure a greater range of PV systems — which gives technicians the flexibility to maintain a wider range of systems with fewer tools. Unlike multimeters and clamp meters, I-V curve tracing allows for both current and voltage measurement when the module is under load. Understanding performance under load provides non-invasive diagnostics for PV module performance.
What is the I-V Curve in a Solar Panel?
The I-V curve in a solar panel shows the relationship between the current (I) and voltage (V) produced by the solar panel under varying conditions. This curve is crucial for evaluating the performance and efficiency of photovoltaic (PV) modules. By analyzing the I-V curve, technicians can assess the solar panels' health, detect any degradation in power output, and identify issues such as shading, damage, or faulty components. The I-V curve provides a detailed insight into how a solar panel converts sunlight into electrical energy.
Solar Cell I-V Curve Equation
The I-V curve of an ideal solar cell is given by:
ph - I0 (eqV / nkT - 1)
Where:
- I: Current output of the solar cell
- Iph: Photocurrent (current generated by light)
- I0: Dark saturation current (the current that flows through the diode in the dark)
- q: Charge of an electron (1.602 × 10⁻¹⁹ coulombs)
- V: Voltage across the solar cell
- n: Ideality factor of the diode (a number typically between 1 and 2)
- k: Boltzmann constant (1.381 × 10⁻²³ J/K)
- T: Absolute temperature in kelvins (K)
The equation for a real solar cell, accounting for resistive losses, is:
ph - I0 (eq(V + IRs) / nkT - 1) - (V + IRs) / Rsh
Where:
- Rs: Series resistance
- Rsh: Shunt resistance
This equation helps understand how a solar cell's current and voltage vary with different light intensities and temperatures, which is essential for optimizing solar panel performance.
What is I-V Curve Testing Solar?
I-V curve testing in solar panels involves measuring a PV module's current and voltage output under different loads to create the I-V curve. This testing is essential for several reasons:
Performance Validation: Verifies that the solar panels are operating correctly and producing the expected power output.
Fault Diagnosis: By comparing the measured I-V curve with the expected curve, technicians can identify issues such as shading, damage, or defective components.
Maintenance Optimization: Regular I-V curve testing helps maintain solar panels' efficiency by detecting and addressing performance issues early.
I-V curve testing is crucial to quality assurance and maintenance for solar power systems.
How to Measure I-V Curve of Solar Cell
Measuring the I-V curve of a solar cell involves the following steps:
- Set Up the Test Environment: Ensure the solar cell is exposed to consistent light conditions, typically using a solar simulator or natural sunlight.
- Connect the I-V Curve Tracer: Attach an I-V curve tracer to the solar cell. This device will vary the load across the cell and measure the corresponding current and voltage.
- Record the Data: The I-V curve tracer will sweep through various voltages, recording the current output at each point to generate the I-V curve.
- Analyze the Results: Plot the recorded data on a graph to visualize the I-V curve. Compare this curve to the expected performance metrics to assess the solar cell's health and efficiency.
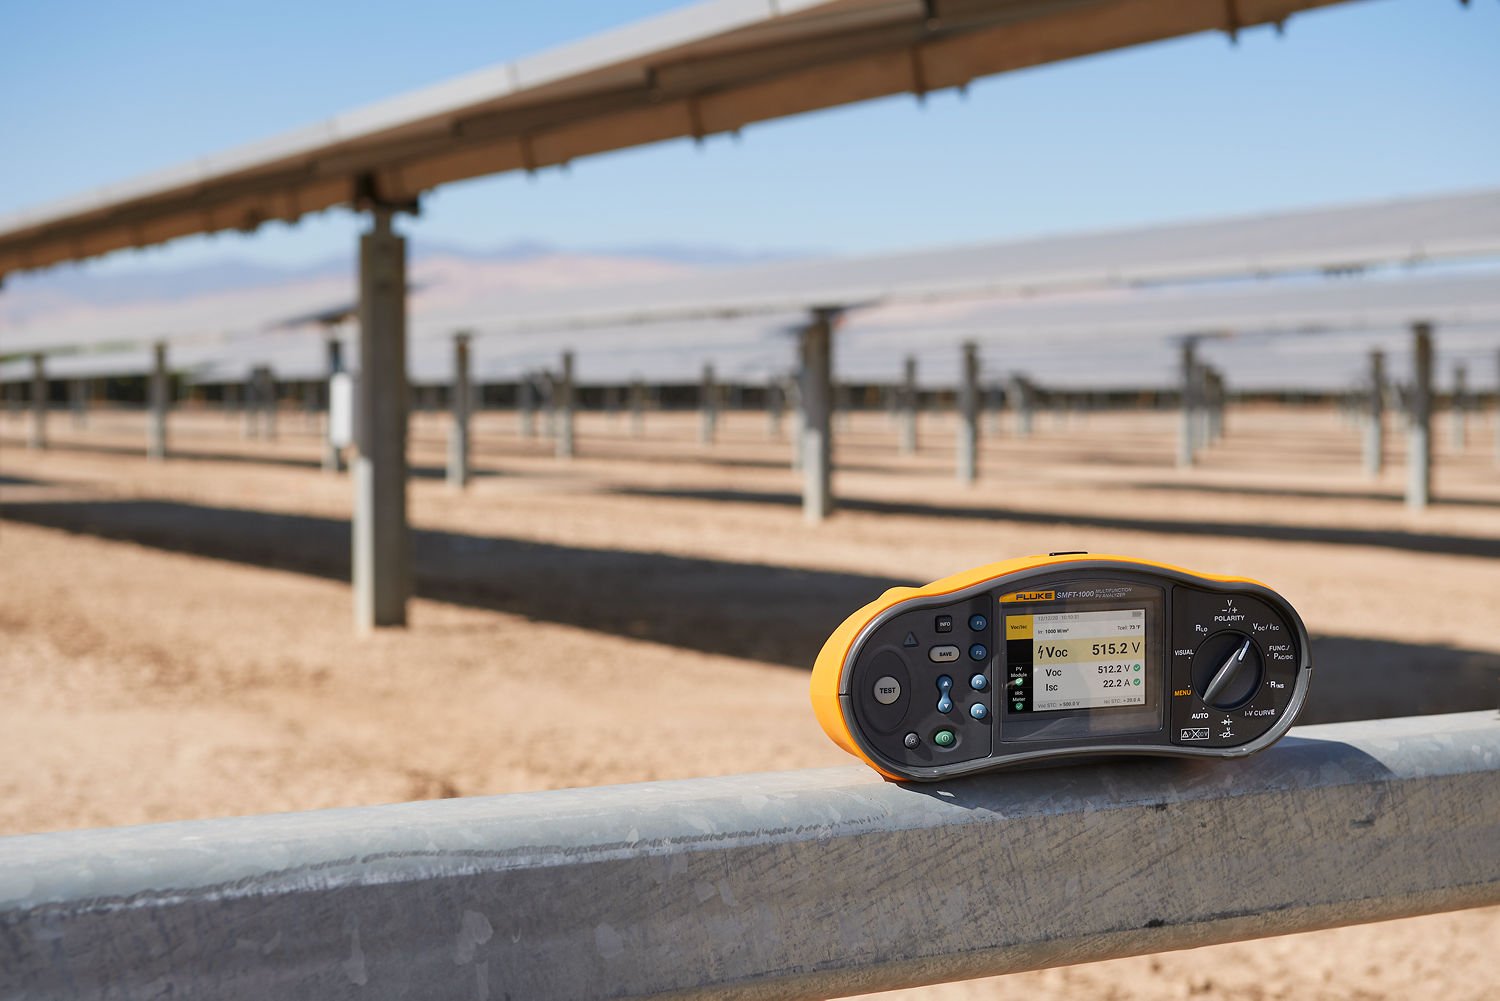
Using tools like the Fluke SMFT-1000 can streamline this process by providing comprehensive measurements and easy data analysis, ensuring accurate and efficient performance evaluation of solar panels.
I-V curve tracers for PV systems
The Fluke Solar Multifunction Tester 1000 (SMFT-1000) is the first Fluke solar tool to offer 1000 volt I-V curve tracing capabilities, allowing users to service larger PV systems and centralize results across tools. In addition to I-V curve, the SMFT-1000 measures grounding continuity, polarity, open circuit voltage and short circuit current, insulation resistance, DC and AC power, inverter efficiency, and diodes. Then you can easily collect, analyze, and report measurement data through the instrument’s integration with Fluke TruTest™ solar software.