By Chuck Newcombe
Power distribution systems serving nonlinear electronic loads often show symptoms typically produced by the presence of harmonic currents. When these harmonic currents are large, they can cause transformers, switchgear, and wiring to overheat. They can also cause voltage waveforms to be distorted, often leading to lower than normal peak voltages, called flat-topping.
What the waveforms tell you, and what a spectrum analysis can add

You can, of course, just look at the point-by-point magnitude of the voltage or current over time. The waveform you see is said to be in the time domain. You may be able to detect the high peak currents and flat-topped voltages that are indicate harmonics are present. Or, using FlukeView® ScopeMeter software, you can actually put numbers to the harmonics that are distorting the waveform. This is useful when evaluating whether or not corrective action is necessary. To do that you first upload the waveform data using the Waveform A button that appears on the FlukeView menu bar. Then, going to the Tools menu, you make the only selection possible: Spectrum. A chart with vertical bars representing the harmonic amplitudes appears. This analysis is said to be in the frequency domain.
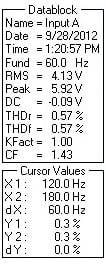
For a test sine wave I measured, the Spectrum Datablock (at right) tells us that the total harmonic distortion (THD) is 0.57%. Cursor settings tell us that the 2nd and 3rd harmonics are each 0.3% of the fundamental 60.0 Hz voltage of 4.13 V RMS.
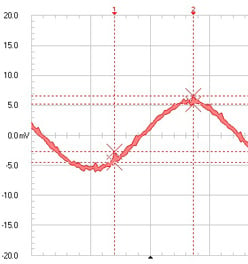
This test was made under ideal signal conditions. The amplitude of the waveform uses nearly six vertical divisions, using three-fifths of the available 255 a/d converter levels to describe the waveform clearly. There were also three full cycles of the waveform available for our spectrum analysis.
What are the limits of the spectrum analysis software under less than ideal conditions?


Real life test conditions rarely present ideal waveforms, so I decided to reduce the available sine wave voltage to see what would happen as the signal became smaller. Using precision resistive attenuators for the output of my waveform generator, I reduced the amplitude of the ScopeMeter input signal without affecting the quality of the delivered waveform.
With 60 dB of attenuation, the signal was reduced to 4 mV, and the ScopeMeter 123 was on its lowest available range: 5mV/div.
Zooming in on a portion of the three-cycle waveform, and using the Y cursors, I was able to highlight some noise bursts on the 4.0 mV RMS signal, showing that there was significant noise (nearly 2 mV p-p bursts) present on the signal at this low level.
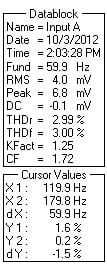
Surprisingly, the Spectrum function of the FlukeView software still provided a reasonably accurate evaluation of the sine wave, the noise showing up as slightly increased harmonic distortion. The total harmonic distortion was now about 3%, and the 2nd harmonic was the largest single harmonic at nearly 2%, but the reported frequency of the waveform was only 0.1 Hz away from the delivered 60.0 Hz nominal value.
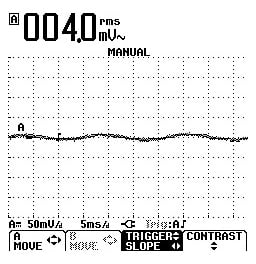
With the function generator signal output held constant, I now forced the ScopeMeter to uprange, further reducing the signal size in the display, and reducing the number of a/d bits available to sample the signal.
On the 50mV/div range, with 4.0 mV RMS still being reported accurately, the waveform trigger is not stable due to the noise on the signal.
FlukeView spectrum analysis has also reached its limits.
The 60.0 Hz frequency is now reported as 63.1 Hz, the THD is about 18%, and the 3rd and 5th harmonics are indicated as about 4%. And, many larger even harmonic components appear in the display.
Since we were able to previously evaluate the same signal with ten times this resolution on the 5mV/div range, we know that both the frequency and harmonic representations on this screen are not accurate.

Conclusion
I recommend that you use waveforms spanning two vertical divisions or more as a source for accurate spectral analysis when using FlukeView.
What else can you learn about a waveform and its spectrum in FlukeView?
The ScopeMeter 123 uses oversampling at 25 MHz to present each displayed sample. What you see on the screen is called an envelope display, where each of 250 horizontal positions shows the maximum and minimum of the many samples taken during each displayed sample period. When you extract the data from a waveform, using Edit-Copy Data from the Menu bar, you can place it in a spreadsheet where you will see columns for the maximum and minimum voltages appearing at each location in the displayed waveform.
If you use Edit-Copy Data on the displayed spectrum, you will find columns of harmonic frequency, harmonic amplitudes, and the phase of each up to 40. With a little work in a spreadsheet, I have actually re-created the waveform displayed on the 'scope by doing an inverse transform on such data.
As you can see from the above, you can get a lot of useful information out of your trusty ScopeMeter, but it's a good idea to know its capabilities and limitations so you don't jump to erroneous conclusions.