ABCs of Portable Oscilloscopes: Part 4, Capturing and analyzing waveforms
Part 4 of this five-part series describes capturing and analyzing waveforms with a portable oscilloscope, answering that key question, "How do I know if a waveform is good or bad?"
You can view Part 3 of this series, Triggering and Isolation. You can also view the complete webinar with audio and animations at the Fluke Training Center.
Capturing a Waveform with a ScopeMeter
With the right scope, you can eliminate a lot of button pushing and knob twisting, and capture an unknown waveform in just a few steps.
With a Fluke ScopeMeter, follow these simple steps to get to a good starting point:
- Observe and follow all safety regulations. Know your test tool operation and specifications.
- Start from a known good scope setup by resetting the scope to a known, default state.
- Connect the return lead to an appropriate reference point, then connect the probe tip to the test point of interest
- Use Connect-and-View™ triggering for an instant, stable display.
When you have a stable display, you have a good starting point from which you can fine tune the settings to best capture or analyze specific parts of the waveform.
To fine tune the display on the oscilloscope:
- Start with by fine tuning the vertical ("Y axis") sensitivity and position. Adjust the signal amplitude so the waveform is greater than 4 vertical divisions in height.
Adjust the time horizontal ("X axis" or "time base") setting to get the best resolution or waveform display time span. Automatic measurements require that at least 3 periods to be visible on screen.
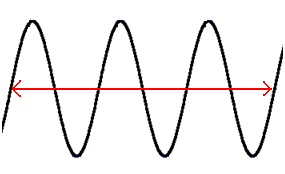
For accurate automatic measurements, adjust the horizontal axis to capture at least three oscillations of the signal - For complex signals, sometimes you will have to adjust trigger level or trigger mode. To do this, increase the trigger level to just above waveform peak (just above the point where you lose triggering), then slowly decrease the trigger level until a stable waveform display is obtained. You can also shift the trigger level to a unique position in the waveform for a stable display.
Waveform Analysis
Before we get into analyzing waveforms, it must be said that diagnosing the root cause of waveforms is beyond the scope of this training because every electrical and electronic system is unique and each will present very different problems for you to diagnose. Having said that, though, having the right test tools and the right troubleshooting techniques and skills makes the task that much easier.
To become proficient in analyzing waveform traces, we must train our eyes always to look at four characteristics of the waveform:
- Amplitude (looking along the vertical axis)
- Time (looking along the horizontal axis)
- Waveform shape, and distortion of waveform shape
- Waveform disturbances, particularly from outside sources
Train your eye to scan up and down the vertical axis and then horizontally back and forth across the waveform time span, and then to look for waveform shape patterns and problems, keeping a lookout for any external disturbances.
The best method is to put a rigid process in place to capture and document waveforms when the system is in good working order. Archive these tests, conditions, waveform screen captures, or measurements for future reference and comparison.
Capture and document waveforms before and after a successful installation, repair, or even an upgrade. Documenting both the good and bad waveforms may provide clues to problems you may encounter sometime in the future. If you don't have that history, you can go to a similar system that is working correctly and compare waveforms between the good and bad systems, looking for any differences.
The next step is to analyze the circuits, understanding the impact or behavior of key components in the system.
- Start by verifying the condition of the power supply circuits, both AC and DC.
- Next, examine the basic, system-level inputs and outputs and feedback loops, looking for ways to narrow the search down to a local device in a system, circuit area, or even a component.
- Look at devices or circuits that come before and after the system or circuit path (that is, circuitry that is "upstream" and "downstream" from the area of interest), trying to isolate the problem to one specific area or device.
Tips, tricks, and techniques
Use the following waveform analysis techniques, tips, and tricks to spot potential problem areas.
Vertical Axis
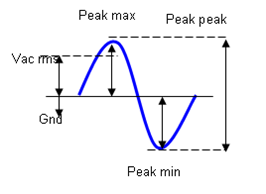

Scanning the waveform's vertical axis can be broken into the following aspects:
- Measure critical signal amplitude characteristics using either built-in automatic measurements or cursors to measure characteristics at specific points on the waveform.
- "Zoom out" by increasing the scope time base (horizontal axis) setting, look for consistency in amplitude from one period to the next or across multiple periods.
- "Zoom in" by decreasing the time base setting and look at the rising and falling edge transitions, looking for any abnormalities. Increasing the time base setting increases the sample rate and therefore the resolution, potentially uncovering hidden problems.
- Watch the overall waveform trace for stability because any vertical fluctuations may indicate improper grounding or common mode signals that are influencing the overall waveform.
Horizontal Axis
Scanning a waveform's horizontal axis can be broken into the following aspects:
Measure critical time characteristics using either the built-in automatic measurements or horizontal cursors
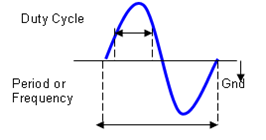
Measurements in the horizontal (time) axis include period, frequency, duty cycle, pulse width, and rise and fall times 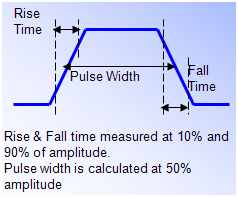
Look for time-related shifts or jitter 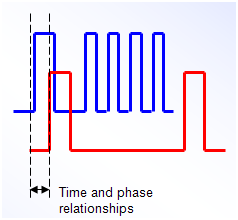
Symmetrical waveforms 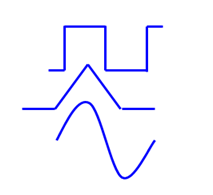
Complex waveform 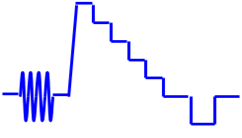
Dynamic waveforms 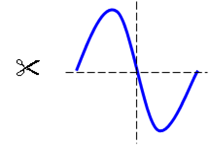
Testing waveform symmetry: Do the quadrants look the same? 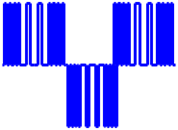
"Flat-topping" of the peak of a sine wave 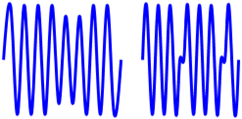
Verify that repeating waveforms are identical 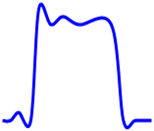
Square wave with non-ideal transitions 
On sawtooth and related waveforms, make sure that change in voltage is proportional to change in time 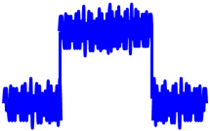
Noise on a square wave 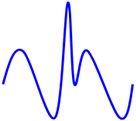
Transient on a sine wave 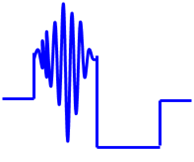
Static discharge on a square wave 
Signal instability in the vertical (amplitude) axis and horizontal (time) axis 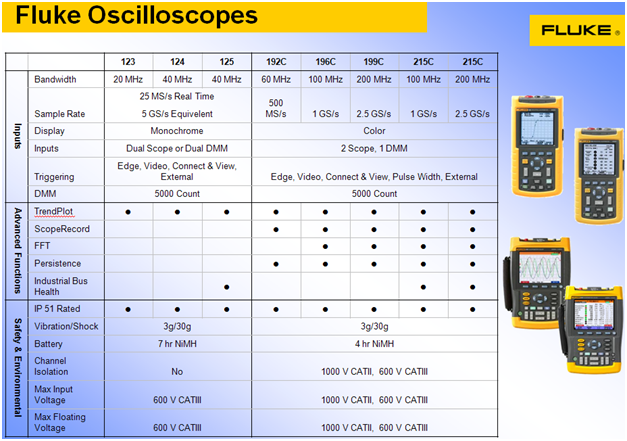
- Increase the time base setting, "zooming out" from the waveform, looking for any inconsistencies in waveform periods from one period to the next. Difference in logic pulses could indicate logic circuit timing issues.
- Zoom back into the waveform by decreasing the time base setting, looking for any horizontal or time-related shifts. Any signal jitter or phasing could be an indicator of instability in a digital circuit's reference clock or logic components.
Wave Shape
Waveforms come in three distinct categories:
- Symmetrical waveform shapes, such as sine, square, triangle, etc…
Complex waveforms - often these are from circuits where signals are summed together forming complex control signals in feedback loops, or from digital logic circuits adding or controlling logic conditions.
Complex waveforms are often encountered when examining:
- Analog video
- Integrations/de-integration time control
- Stair step gain control
- Analog feedback loop control
- Logic data pulses or bit patterns
Dynamic signals are those that dynamically change key waveform characteristics in order to control some condition. For example, one signal is modulating the amplitude or frequency of another signal conveying information. Today's electric motors use variable pulse width modulation to precisely control electric motors and improve their energy efficiency.
Dynamic waveforms are often encountered when examining:
- Modulated carriers, such as AM, FM, PSK, Phase, and so on
- Magnetic resonance imagers
- Variable frequency drives (pulse width modulation)
- Radar and sonar pulses (positioning sensors)
Wave Shape Issues
Next we'll take a look at waveform characteristics to help diagnose potential problems.
We can use key shape-related characteristics to look for problem areas. For example:
- Waveform symmetry: If you were to "fold" and cut a symmetrical waveform along the center line vertically and horizontally, would the opposing quadrants appear exactly the same?
- Peaks and valleys: For sine- and triangular-shaped waves, look at the positive and negative peaks to ensure there is no evidence of flat-topping or other transition aberrations. With square or pulsed waveforms, check the high and low levels are flat and "straight."
- Wave shape repetition: Increase the time base (horizontal axis) span to verify that waveforms over multiple time periods are identical.
- Waveform transition: Inspect the transition points on the waveform, making sure in the case of triangular or sine waves that the transition is clean; with square and pulsed waveforms, that the transition is a "sharp" 90 degree edge. For square or pulsed waveforms, "ringing" (oscillations) at the high or low transition points could be an indication of reflections occurring in the signal transmission path as a result of impedance changes.
- Linear or logarithmic changes: Decrease the time base span to inspect the linear or logarithmic transition. Use the display reticle to assess if the change in voltage level is proportionate to the change in time.
Waveform Disturbances
Waveform disturbances are usually external electrical phenomena that have found their way into the circuit to influence the signal in one of the following manners:
Noise is often induced electromagnetic interference, usually from heavy duty electrical machinery or interference from radio frequency transmitting devices. Any length of electrical conductor can be an antenna that picks up radiating electromagnetic fields from devices such as cell phones and variable frequency motor drives, or from lightning.
Transients or "glitches" can be induced by sudden changes in heavy duty electrical loads such as switch gear. They can be created by aged breakers turning on or a fan or pump starting up. The worst case scenario is when a transient comes down the distribution system as a result of a lighting strike.
Static electricity can build up in conveyor belts, pulleys, and other rotating machinery. Electrical conductors in close proximity to these rotating devices can become the lowest resistance path to earth ground, discharging any built up energy.
Signal instability Check for shifting along the vertical and horizontal axes. Any instability in ground references or dc offset changes could be an indicator of earth ground loop problems. Any horizontal, time-related signal jitter or erratic phase shifting could be as a result of problems in digital circuit clocks and signal transmission pathways.
Fluke Oscilloscopes
The concepts and techniques presented here can be explored with the entire range of Fluke portable oscilloscopes. Available in bandwidths from 20 MHz to 200 MHz, Fluke ScopeMeters have the performance and features to tackle a wide variety of measurements, from routine troubleshooting to demanding tasks like finding random events. Fluke oscilloscopes are specifically designed to operate in harsh environments - out of the lab away from a bench.
- ABCs of Portable Oscilloscopes: Part 1, Multimeters and Oscilloscopes
- ABCs of Portable Oscilloscopes: Part 2, Signal Input and Processing
- ABCs of Portable Oscilloscopes: Part 3, Triggering and Isolation
- ABCs of Portable Oscilloscopes: Part 5, Capturing Intermittent and Random Events with a Portable Oscilloscope


