Breaking down the process and rationale for successfully adding these sensors for condition monitoring
By John Bernet, Fluke Corporation
The need for actionable data in plants and other facilities is typically unquestioned by most reliability and maintenance teams. Where people typically diverge is in a few areas:
- When to measure/gather data
- How frequently to measure
- Technologies to add to assets

Why select vibration monitoring?
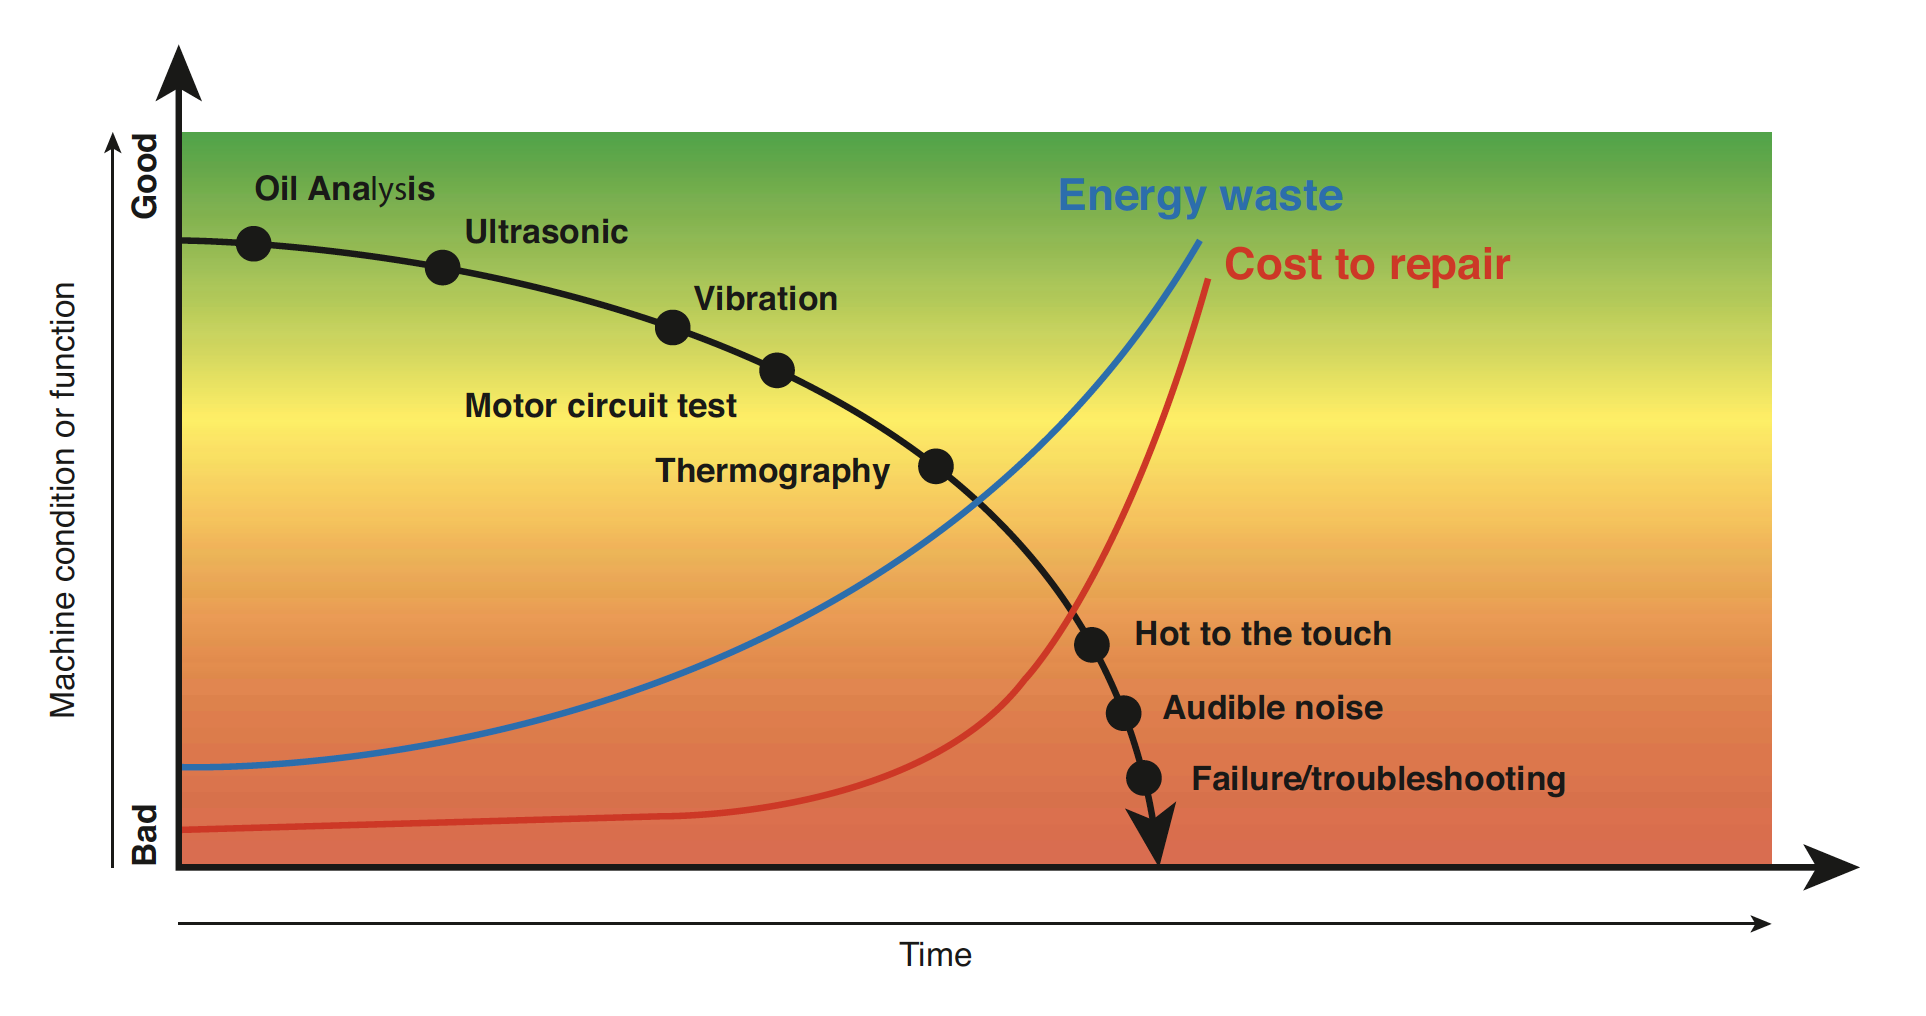
The P-F Curve (see Figure 1) illustrates a more practical view to consider the time between potential failure and when the asset can no longer perform all functions per the specifications. Many reliability industry leaders feel using this P-F interval is important because:
- Long before an asset fails, it usually begins to consume more energy and lose overall performance.
- The earlier a problem can be detected and corrected, the less it costs to repair (an ounce of prevention is worth a pound of cure).
Certain technologies have the ability to detect emerging failures long before the asset fails. These are often called “predictive technologies,” and are typically part of condition monitoring programs. This is a theoretical framework that may vary from asset to asset, and the point is not to say that personnel should repair a machine at the earliest sign of failure because it may be too early. These early indicators simply signal that additional maintenance actions, such as lubricating the bearings or beginning to plan and schedule maintenance, may help avoid unexpected failures and downtime. These technologies include:
- Oil analysis
- Ultrasound
- Vibration
- Motor circuit testing
- Thermography
Each technology may be used in combination or individually.
When should vibration screening be used?
Every machine component produces a unique vibration signal. Signals displayed in the spectrum often form characteristic patterns. Pattern recognition is a key part of vibration analysis, but significant training and experience are necessary to recognize and read the patterns. Vibration analysis can watch bearing wear across 12 to 18 months as they go from slight wear (no action) to extreme wear (replace bearings immediately). Oil analysis can only be performed on oil-cooled bearings (fewer and fewer are used every day). Ultrasound finds bearing wear too early to replace the bearings (use to know when to grease the bearings instead).
Table 1 is a simplified overview of the patterns used to recognize the four most common machine faults, particularly in rotating assets.
| Machine fault | Frequency and Axis | Component found | Advanced Severity | |
|---|---|---|---|---|
| 1 | Imbalance | 1X - All radial directions | On affected component | Higher amplitude 1X |
| 2 | Misalignment | |||
| Parallel | 2X - Radial and tangential | Both sides of coupling | Higher amplitude 2X | |
| Angular | 1X - Axial | Both sides of coupling | Higher amplitude 1X | |
| 3 | Looseness | 1X harmonics-all directions | On component | Higher harmonics |
| 4 | Roller bearings | Non integer-all directions | On affected component | Harmonic, sidebands, noise hump, noise floor |
Table 1. Patterns of common machine faults
Vibration screening can identify abnormalities caused by most of these faults as they begin — in the early stages, providing precipitous warning of impending failure. The severity of the four common faults can be tracked over time based on the history from hundreds of thousands of machines that have been analyzed by many vibration experts over 30 years. This knowledge and experience have been incorporated into rule-based algorithms and a baseline database that have been proven to be effective on standard rotating machines — motors, pumps, fans, compressors, blowers and single-shaft spindles.

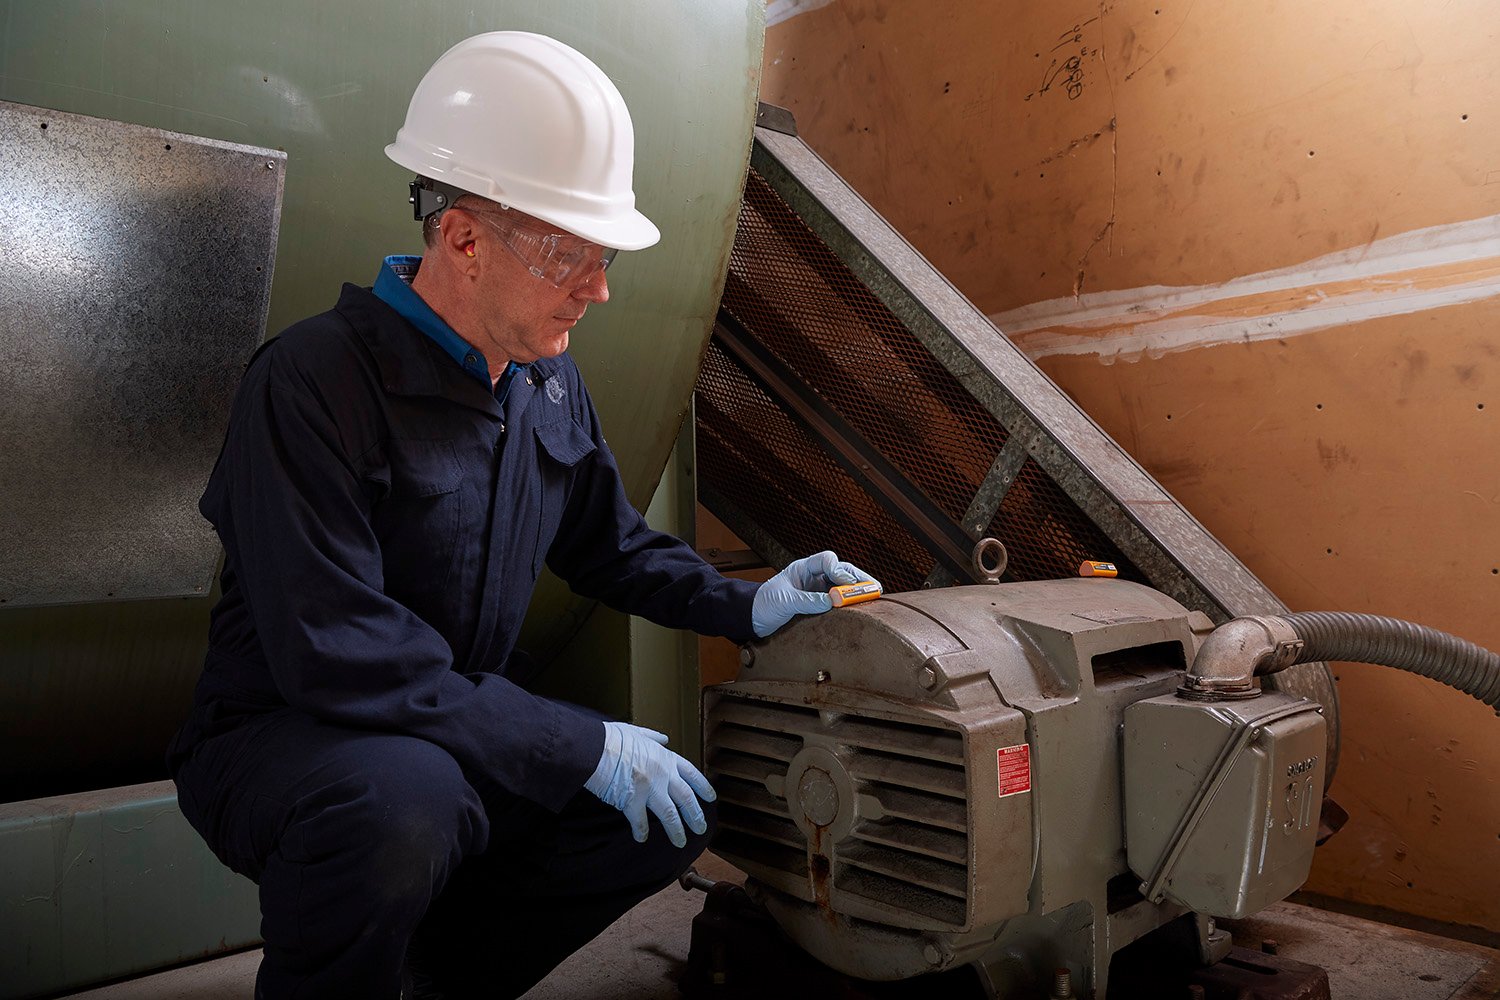
Handheld vibration meters can be used for route-based, preventive strategies. A more flexible method is screening with continuous remote, wireless sensors. Regardless of the method used, vibration technology can provide reliability and maintenance teams with actionable data that can help determine when further analysis is required to decide when steps such as relubrication, repairs or replacements should be made.
How should sensors be set up on assets?
Triaxial sensors are placed on assets throughout the facility, perhaps initially focusing on problem equipment to determine the best way to improve their operation. Application is simple, and setup can typically be completed in under an hour. All rotating machines can experience vibration. Pumps, fans and motors have different faults that vibration screening can identify. For a complete list of equipment that may benefit from vibration screening, see “Ideal assets candidates for vibration screening” in this article.
What happens to all the data?
To mitigate lost time and data entry errors, the sensors should send data, via cloud-based software and a Wi-Fi connection, directly to a source viewable on a PC or using a connected mobile device. These data are available within seconds so that personnel can assess asset health. All stakeholders can view the data whenever they would like and wherever they are.
Ideally, this data can be automatically delivered to an enterprise asset management system or a computerized maintenance management software system. With direct feeding This integration can be the first step toward connected reliability, in which all disparate data sources within a facility are captured and aggregated in one storage location and viewable anywhere on any type connected device.
Ideal asset candidates for vibration monitoring Pumps
- Vertical pump (12’ to 20’ from grade to top of motor)
- Vertical pump (8’ to 12’ from grade to top of motor)
- Vertical pump (5’ to 8’ from grade to top of motor)
- Vertical pump (0’ to 5’ from grade to top of motor)
- Horizontal centrifugal end-suction pump (direct-coupled)
- Horizontal centrifugal double-suction pump (direct-coupled)
- Boiler feed pump (turbine- or motor-driven)
- Positive displacement horizontal piston pump (under load)
- Positive displacement horizontal gear pump (under load)
Fans
- Belt-driven fan (1,800 to 3,600 rpm)
- Belt-driven fan (600 to 1,799 rpm)
- General direct-drive fan (direct-coupled)
- Shaft-mounted integral fan (extended motor shaft)
- Axial flow fan (belt- or direct-driven)
- Large forced draft fan (fluid film bearings)
- Large induced draft fan (fluid film bearings)
- Vacuum blower (belt- or direct-driven)
Compressors
- Reciprocating chiller (open motor and compressor)
- Reciprocating chiller (hermetic motor and compressor)
- Reciprocating air compressor
- Rotary screw air compressor
- Centrifugal chiller (hermetic or open motor)
- Centrifugal air compressor with or without a gearbox
- Centrifugal air compressor – internal gear (axial measurement)
- Centrifugal air compressor – internal gear (radial measurement)
Blowers
- Lobe-type rotary blower (belt- or direct-driven)
- Multistage centrifugal blower (direct-driven)
Cooling Tower Drives
- Long, hollow-shaft (motor)
- Belt-drive (motor and fan – all arrangements)
- Direct drive (motor and fan – all arrangements)
Generic Gearboxes
- Single-stage gearbox
Machine Tools
- Machine tool motor
- Machine tool gearbox input
- Machine tool gearbox output
- Machine tool spindle – roughing operations
- Machine tool spindle – machine finishing
- Machine tool spindle – critical finishing